


A summarized look at the recent demographic report
Photo Credit: Statistical Forecasting LLC (Demographics Report)
The front page of the demographic study created by Dr. Richard S. Grip.
March 9, 2020
The Glen Rock Board of Education recently held a public meeting on Feb. 11, 2020, discussing the recent school district demographic report. This 50-page report was requested by the Board of Education to take a closer look at enrollments leading towards the 2024-25 school year at Glen Rock Public Schools, hiring Statistical Forecasting LLC, to compose the highly detailed report.
Statistical Forecasting LLC has been a well-known name in school demography serving the New York-New Jersey Metropolitan area since its founding in 1998 by its Executive Director, Dr. Richard S. Grip. The company has seen much success under Dr. Grip with clientele varying from K-12 school districts, municipalities, architectural firms, law firms, and universities. Dr. Grip prides his clientele with the largest being New York City Public Schools since 2006. Dr. Grip himself is considered a leader and expert in his field graduating Rutgers University with a Doctorate in Educational Statistics and Measurement. As an expert in his field, Dr. Grip has testified as an expert witness in school demography in several court hearings and has written numerous publications on school demography, presenting his findings nationally.
The Purpose of the Study
The purpose of the study per Dr. Grip was to project the enrollments of Glen Rock Public Schools for the next five years. The study is only capable of projecting five years in the future since the demographer begins to project children yet to be born. Tasks completed by Dr. Grip during this study were the analysis of the community population trends and its age structure, fertility rates, birth counts, historical enrollment trends by grade and district-wide configuration, Grip also researched new housing and projected enrollments based on student yields and housing resales in town.
Community Demographics
Glen Rock has seen a steep rate of growth from the 1940s to the present per Figure one, with a peak population during the 1970s, decreasing in the 1980s before reverting to stable growth. The line cutting down through 2010 in Figure one is the last census taken nationwide and will be updated from the 2020 census, all data past the line to the right is the projected population through 2040 by a third-party agency called the
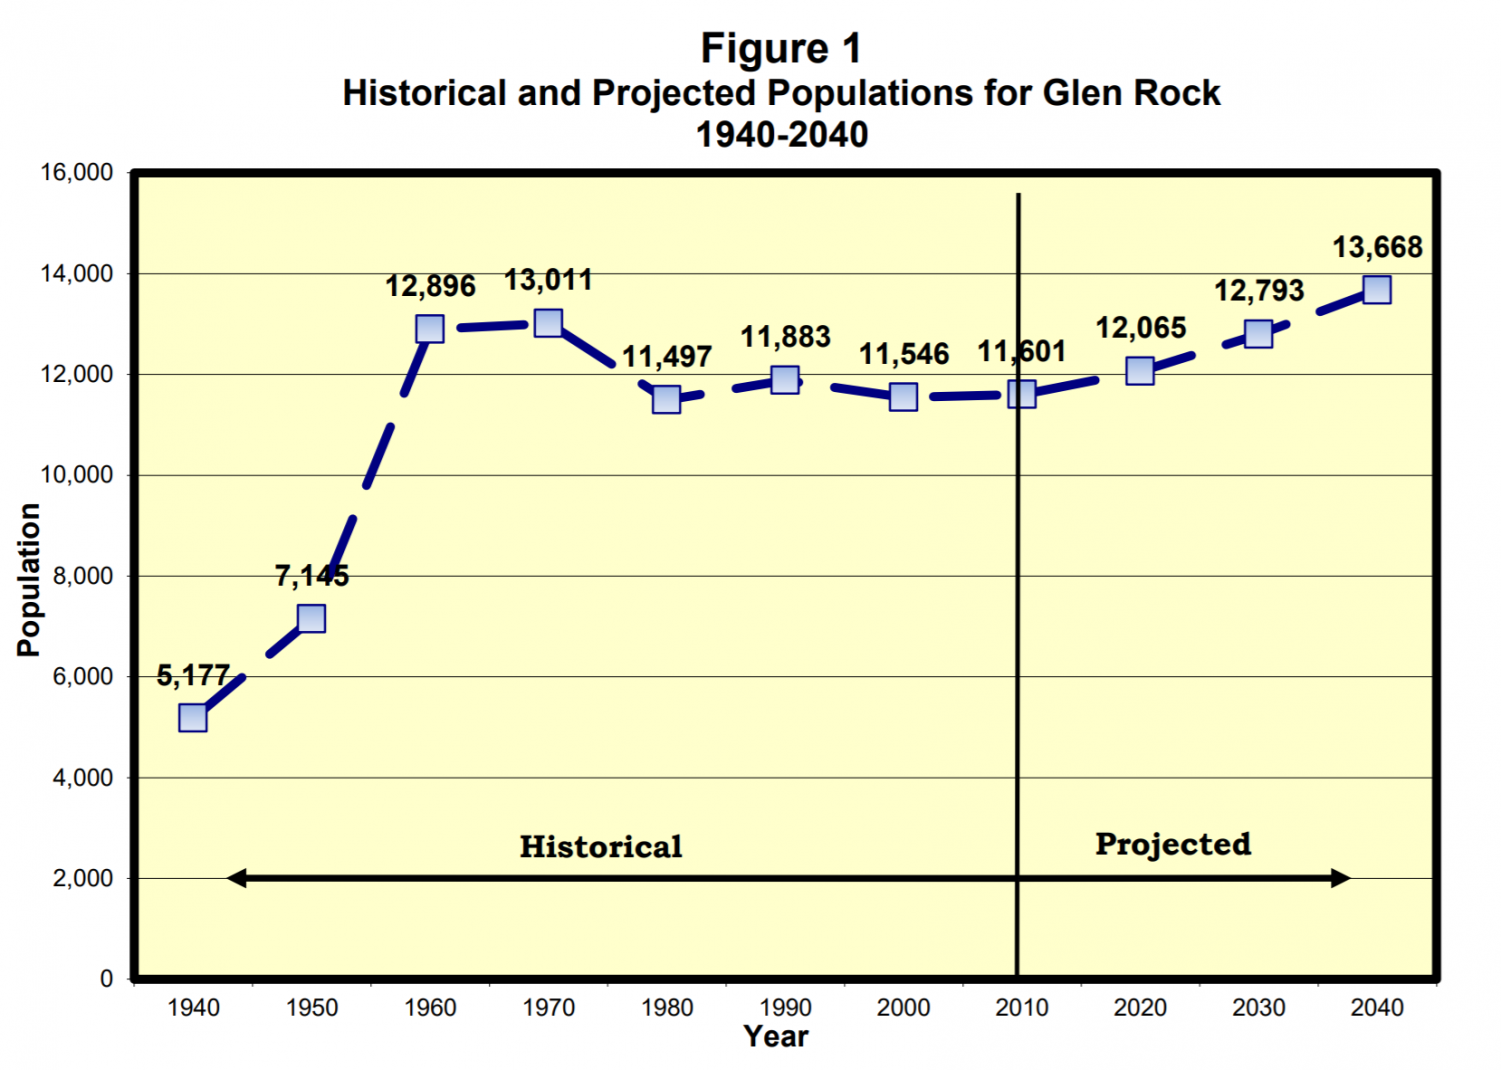
Graph showing Glen Rocks past, and estimated population.
North Jersey transportation planning authority. To improve data, the use of the American Community Survey (ACS) form 2013-17 helped provide information to the study but was described as “not a very reliable instrument from the census because they [ACS] only take one percent samples over a five year period for five percent total sample.” from Dr. Grip.
Glen Rocks racial makeup isn’t super diverse with 90 percent of the population in 2008 and 87 percent in 2010 being white, Asians are the second-largest race in town making up 9.1 percent of the population, this includes residents having origins in the Far East, Southeast Asia, or the Indian subcontinent. 12.4 percent of the town’s population is foreign-born which is much smaller than the state average which is 22.1 percent, this makeup is consists of mainly Chinese and Indian origin.
The educational makeup of the town show Glen Rock is highly educated, 72.9 percent of the population has a bachelor’s degree or higher, surpassing the state average which is 38.1 percent, this can translate to higher incomes which are seen with a median family income roughly equaling $191,000, almost twice the state average. In the community, there are 4,000 housing units, 96 percent of which are single-family homes with a median value of owner-occupied units being $622,000.
Historical Enrollment Trends
Currently, for the 2019-20 school year, there was a total of 2531.5 students, the .5 comes from students that attend vocational schools. This number is the highest seen in the last decade as Glen Rock Public Schools continue to increase in student size each year with fairly stable enrollment, abruptly increasing in the 2016-17 school year before restabilizing. The school only gained about 105 students in 10 years “which in my business is very small.” Dr. Grip said.
The method to calculate enrollment projections was the Cohort Survival Projection Method, which can be defined “as a simple method for forecasting what the future population will be based upon the survival of the existing population and the births that will occur.” stated by the San José State University Department of Economics. The method has been in use for 90 years and is New Jerseys’ preferred method for projecting enrollments.
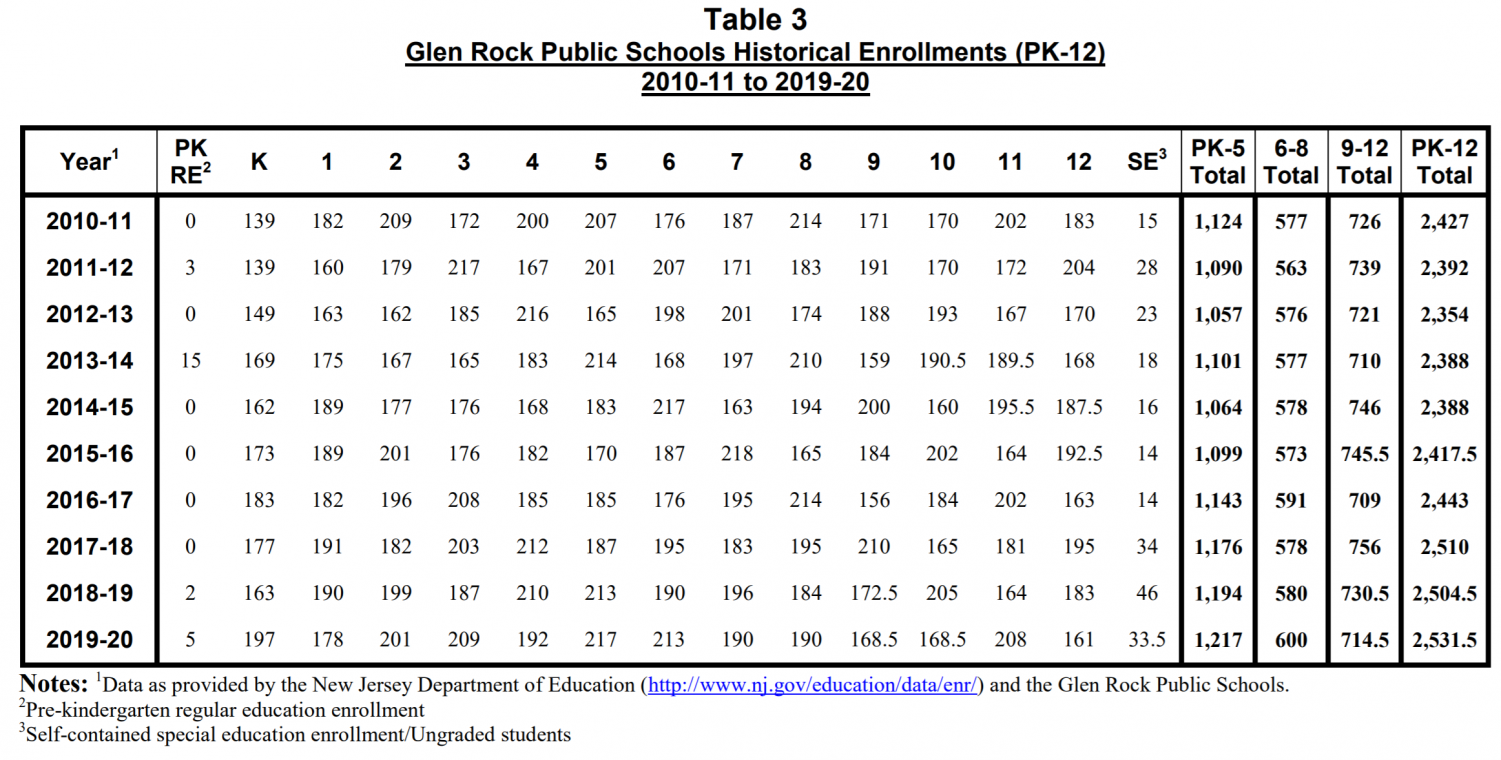
Glen Rocks historical enrollments per grade from 2010 to 2020.
The use of Survival Ratios or other times referred to as the great progression ratio was a significant counterpart to the study and was used for all 13-grade levels for the previous 10 years. A ratio per grade level for the decade is then created and an average formed for that grade level for that year. Dr. Grip looked at the averages from, finding that in the last four to five years, nine of the 13 ratios were above one which meant that inward migration had occurred in the district, these included pre-k through 8th grade and the four remaining ratios below one were in the high school. Projecting future enrollments, Dr. Grip assumed that the ratios would hold constant for the next four to five years.
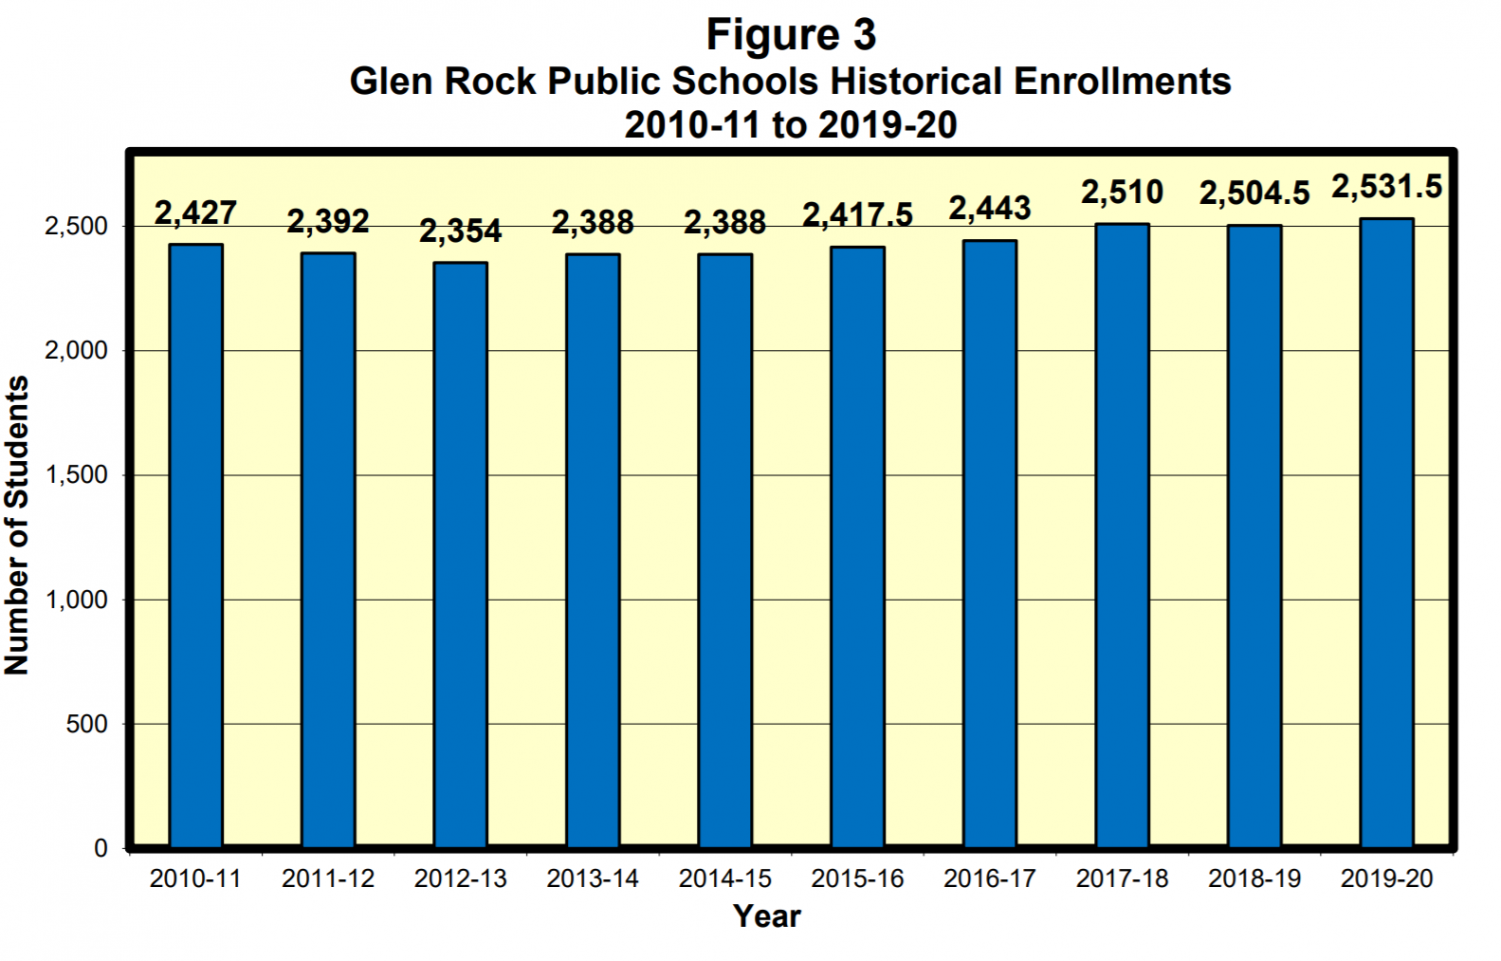
Graph showing Glen Rocks Schools Historical Enrollment from the 2010-11 school year to the 2019-20 school year.
The historical enrollments which were measured from Pre-K through 12th grade did not see much change and were considered by Dr. Grip as “Nothing really substantial, just going up slightly.”
Although the graphs may show little growth, it is still important to look at enrollments per level since they provide a look into the future of enrollments. These levels are not split by grade but rather by the type of school, this means elementary, middle, and high schools.

Graph showing enrollment by grade levels.
The split is better seen in figure four where the topline with the most number of students in the elementary schools with 1,217 students for the 2019-20 school year, enrollment has increased in the last five years and has yet shown signs of slowing. The middle line shows high school enrollments and has been stable with little to no variation, this is in part due to graduating seniors. The middle school, the bottom line, has also been stable with enrollments and sees frequent student turnover.
Phenomena
There’s a phenomenon that occurs that is observed by demographers called Kindergarten and First Grade Replacement. Replacement is either positive or negative and is the amount of incoming kindergarten or first-grade students to the graduating senior class in high school. For the Glen Rock school district, negative replacement occurred in five of the last nine years, this is due to the number of the graduating 12th-grade students being greater than the number of kindergarten students replacing them in the following year. For the four other years, positive Kindergarten replacement occurred and happens when the number of incoming kindergarten students is greater than the graduating senior class.

Graphs showing how Kindergarten and First Grade Replacement affect enrollment.
Before the 2015-16 school year, Glen Rocks Kindergarten program was a half-day program. During the study to assess replacement, Dr. Grip had to look at enrollments in the first-grade classes for the school years previous and possibly gained students back due to parents possibly sending children to private kindergartens.
When looking at the Total Enrollment Change Graph, blue is the enrollment change and it is not small. This change is due to inward migration and the reasoning behind this was due in part by how prestigious the district is as well as the ease of commuting to the city.
Birth Counts
During the study, Glen Rocks’ birth counts had been used to project incoming students five years after birth, years analyzed were 2005 through 2018. Observations from the data showed that a decline through 2012 had occurred before reversing trend.

Graph showing the Historical Birth Counts for families living in town from 2005-18.
Even though there is a smaller birth rate observed in 2018, 101 births, compared to 2005, 121 births, it has not affected the kindergarten replacement and does not impact it negatively since residents move into town, balancing the ratio out.
When looking at the graph related to birth counts, the first column is Births per year, the second column shows the actual amount of kindergarten students enrolled five years later, and third column is the survival ratio.
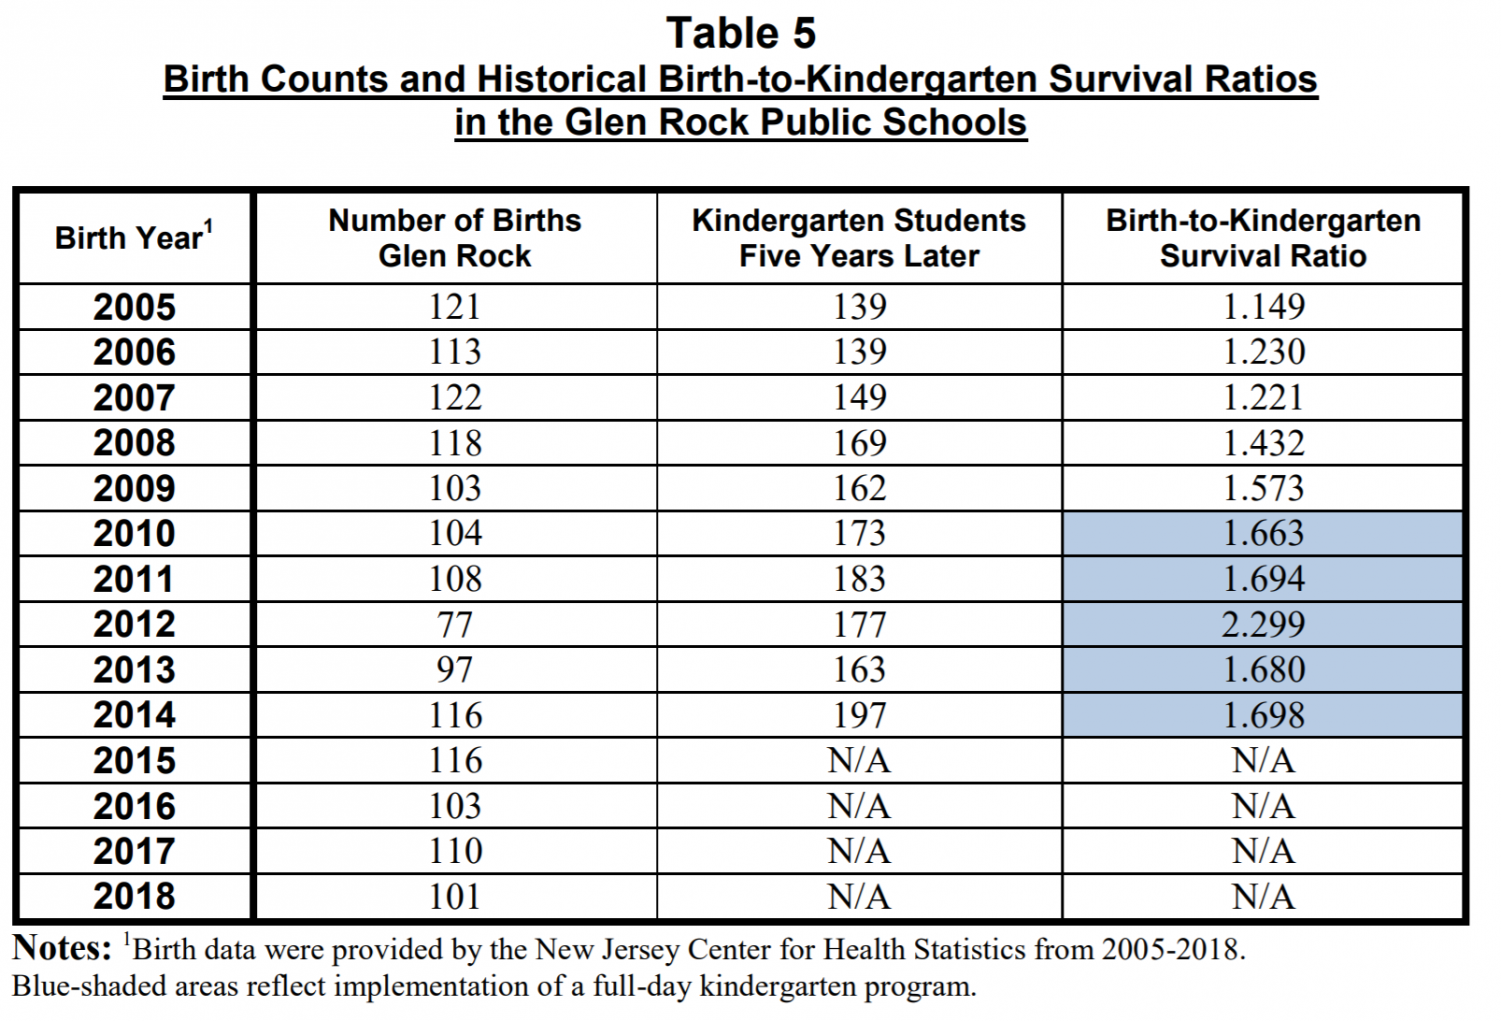
Table showing the historical births, enrollments five years after, and birth-to-kindergarten survival ratios.
What has to be considered throughout the study was the Board of Educations switch to full-day kindergarten in 2015 since it will show a higher value of students enrolled rather than half-day.
Most districts with half-day kindergarten are typically below 1.000 when looking at survival ratios, for the district before the implementation of full-day kindergarten, ratios highlighted in blue, these ratios were above the 1.000 margins and increased immensely in the years after full-day kindergarten was implemented. In 2012 the ration increased to 2.3 which was caused by the enrollment of 100 students not born in town.
Age Groups
To observe the age groups located in town an age pyramid was created in which the percentage of males in each five-year increment for their respected age and put them back to back with females. Males are represented by the orange bars on the left of these graphs, right for females. For the 2000 age pyramid, the population was greater in the older age groups, not many residents in town were in their 20s or 30s. The greatest male population was from the ages of 40-44 while 35-39 was the greatest population for females.

Age pyramids show the age shift that the community saw from 2000 to 2010
The 2010 age pyramid shows that the age of the population shifted upwards on the 2010 graph since few residents left the community. This caused the graph to overall shrink in the 20s and 30s age group which is a small dilemma since most females tend to have their children in that range, for the town, this causes birth rates to shrink. The overall population change from this saw the biggest gain in both the male and female groups in the 15-19-year-olds, as well as a large portion of the population, make up surrounding these ages. These members of the community are presumed to be students in the district and possibly a few college students. The Biggest losers when looking at the graph are the females from the 30-39 age range that lead to the lower birth and fertility rates that were brought up during the study. The possibility of why no change had recently occurred per doctor grip was that due to high taxes, “it really self selects and keeps certain residents from coming in.”
Housing In the Community
When it comes to housing in Glen Rock, the town has around 4000 housing units for an estimated total population of 11,829 residents. With an obvious growing population, the Glen Rock Planning Department was contacted during the study to discuss any possible developments, currently on development has been planned at the address of 261 Rock Road with 11 affordable apartments that have been approved. With this being the only serious form of development in the community, it was projected to bring in only about five students causing no real impact to the district alongside new construction of homes in town.
New housing seemed not to be an issue for the community but rather the home sales in the community. When observing the graph it shows the yearly amount of houses sold, and where it gets low in the ⅔ portion of the graph is the housing market crash of 2008-10. After the crash ended, the market began the process of restabilizing, showing in town for the last five years, decent stability.
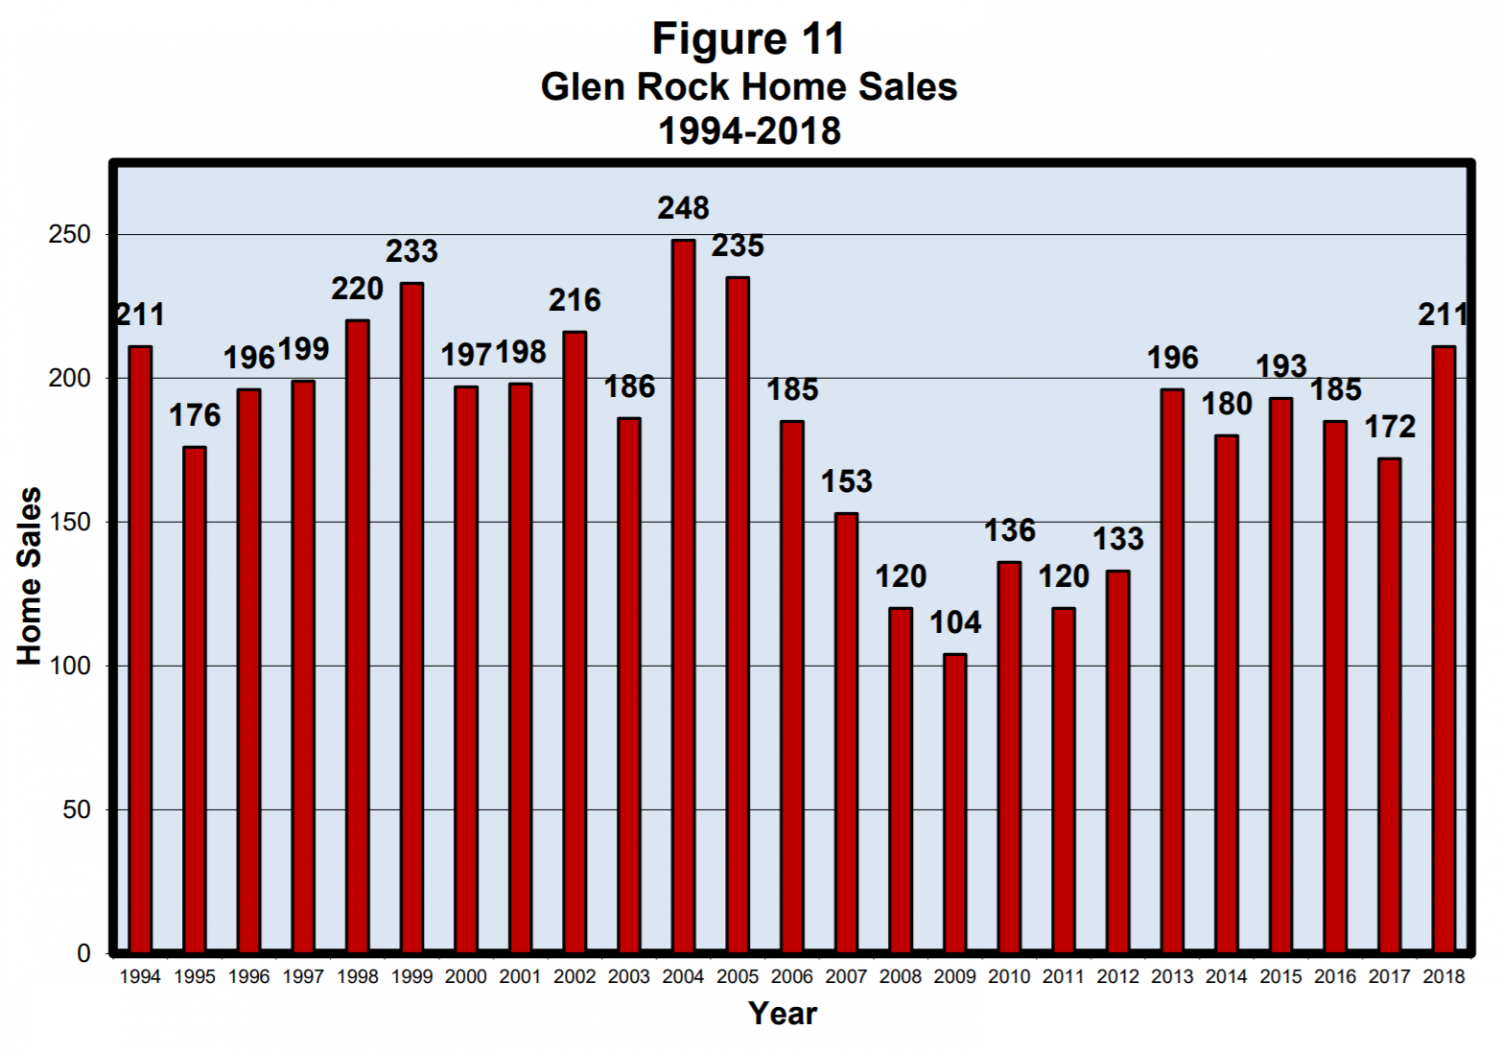
Graph showing home sales from 1994-2018.
The cause of the stability is due to the new couples and families that have begun to move into the town with children in tow or already at young ages. This has helped cause pressure in the Birth to Kindergarten Ratios.
Dr. Grip referred to the turnover analysis he conducted to be the most important piece of his report. The turnover analysis was an independent analysis that projected the number of houses at different lengths of ownership projecting future students. This analysis was focused on single-family homes since there is a lack of townhouses and condos in the community. To create the projections using the cohort survival ratio for better projections for the 20 years of sale data. To project data, three inputs were used, Weighted average turnover rate by length of ownership, current number of homes by length of ownership, and student yields by length of ownership. Every individual house was analyzed, tracking the life cycle of an ownership used with data from the state containing sale dates and price as well as the year the home was built from the years 1998-2018.
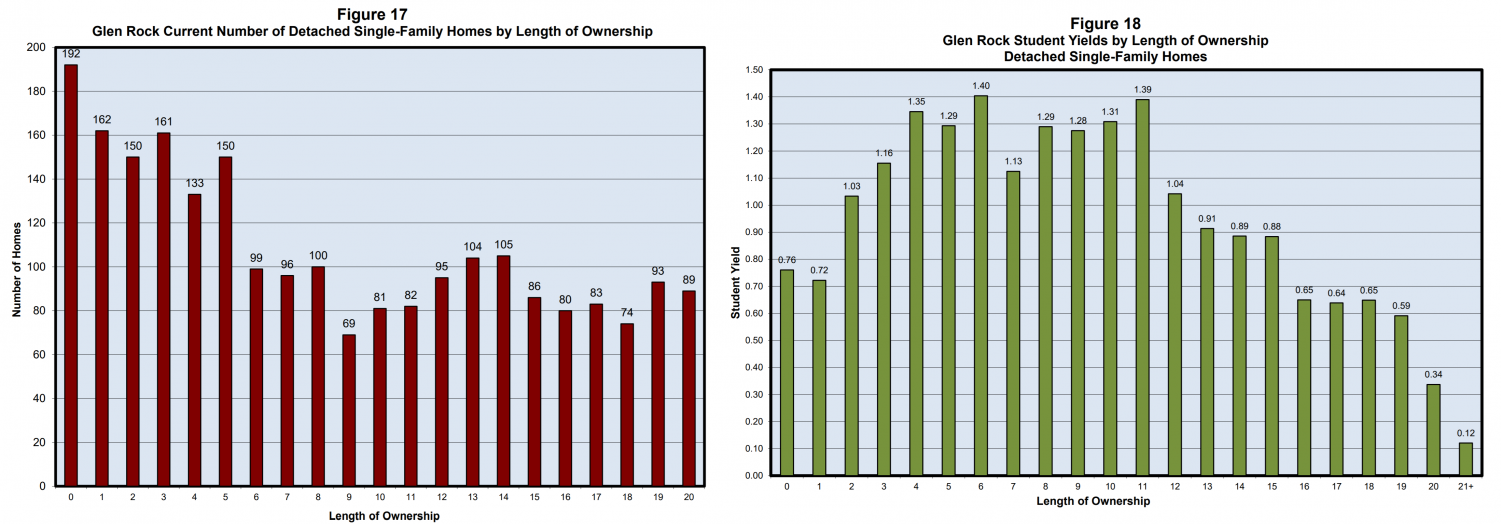
The two graphs show both the number of single family homes in town as well as student yield for these homes.
Referring back to the three inputs, the weighted average turnover rate by length of ownership saw six percent of homes sold in the first year ownership with percentages rapidly declining after this period. Current number of homes by length of ownership show turnover in one through five years since most residents want to move into “bigger and better” homes. Then there’s student Yield by length of ownership which was found pairing/joining students to the addresses that were provided by the school database and property database from the town. Student yield for longer-term residents varies with the largest number being 1.4 students per household owned for six years and then goes down with time since these students graduate and go to college.
The methodology used for enrollment projections based on housing used current data for the length of homeownership and historical turnover rates to either advance homes to their next year of ownership or the selling of homes returning its years of ownership to zero. Once all calculated, current distribution of ownership is advanced five years out and based upon the average selling rates it is then multiplied by the number of students that each grouping of years of ownership would have to get an estimated enrollment of students. Two scenarios were created were scenario one found that based on the data supplied, 2,800 students would be enrolled in the district by 2023, attending grades K-12, scenario two predicted that 2,650 students would be enrolled by 2023. These scenarios excluded variables including birth rates, migration, and new housing, the only variable used in this analysis was the turnover rates of housing. The numbers of predicted enrolled students are nearly the same as the estimated enrolled students found in the cohort models.
Enrollment Projections
In the study, two enrollment projection models were used to find the estimated total enrollments for the next five school years. The first model, in blue, was projected for a total gain of 170 students in a five year period from the 2020 school year to the 2025 school year. The second model, in green, projected a total gain of 262 students in the same five year period. When looking at these projections by grade, the most gain seen is in the elementary schools, yet gain in enrollment is in all grades.
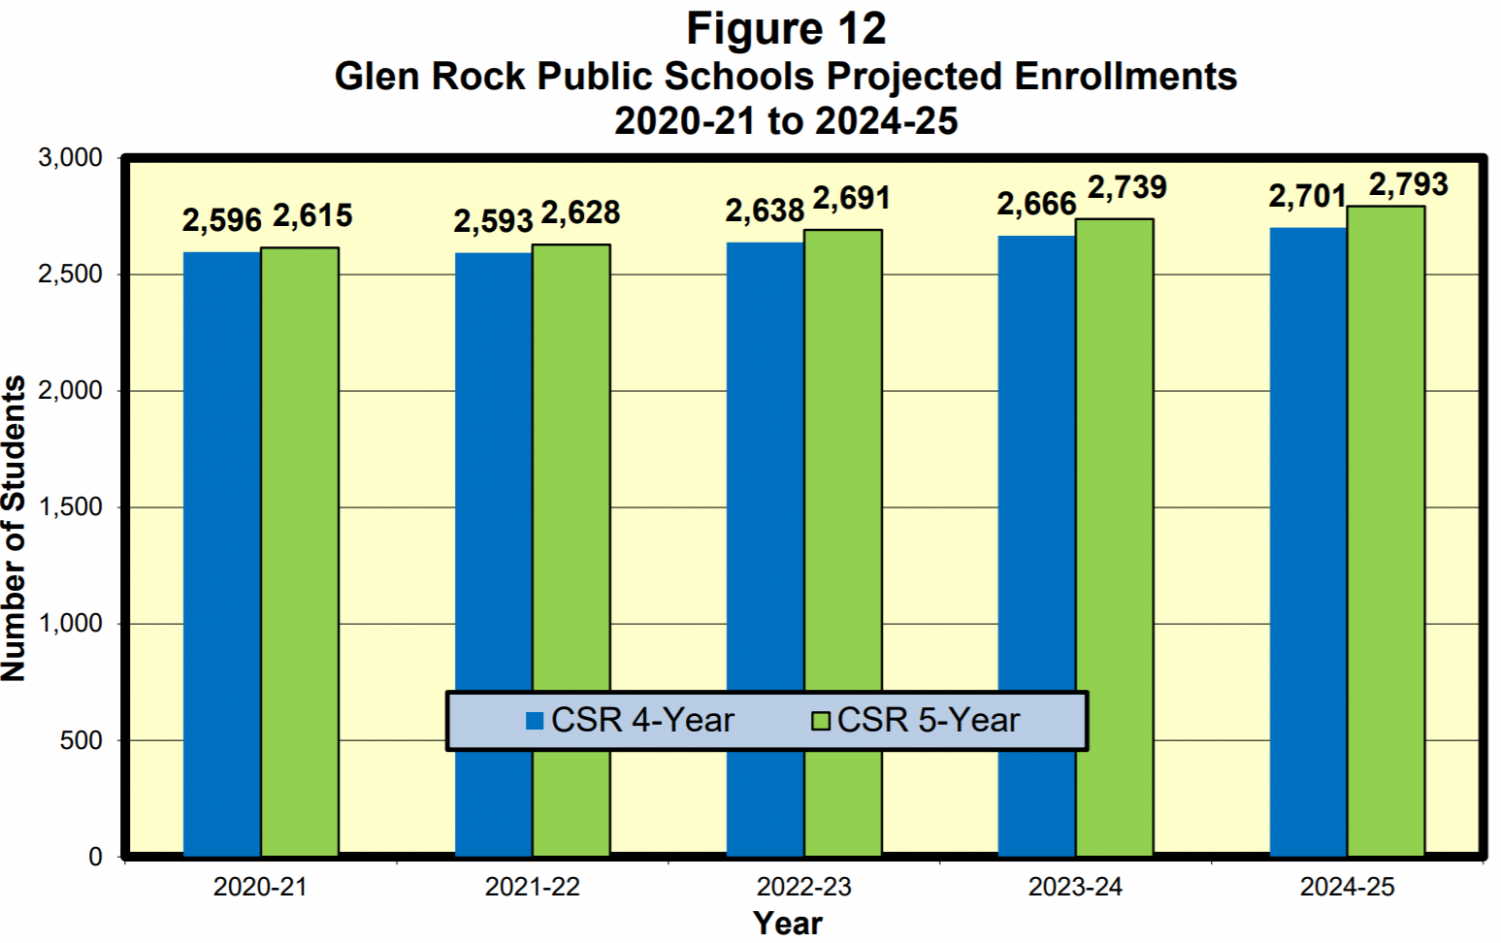
The graph shows the two models used to calculate projected enrollments.
With this heightened enrollment, the capacity of schools becomes a worry. Capacity was analyzed to compare these future enrollments to the capacity of the current buildings. Capacity is based on how space is used in a school district based on the district’s Long Range Facility Plan (LFRP), not fire code capacity. When it comes to Glen Rocks LRFP, it has not been updated since 2005 with the last reference to the plan in 2009 following a review of the plan by the New Jersey Department of Education, this was before the addition that was completed on the high school in 2011. In the capacity analysis table, enrollment was not projected by grade level which clusters grades with their respected terms.
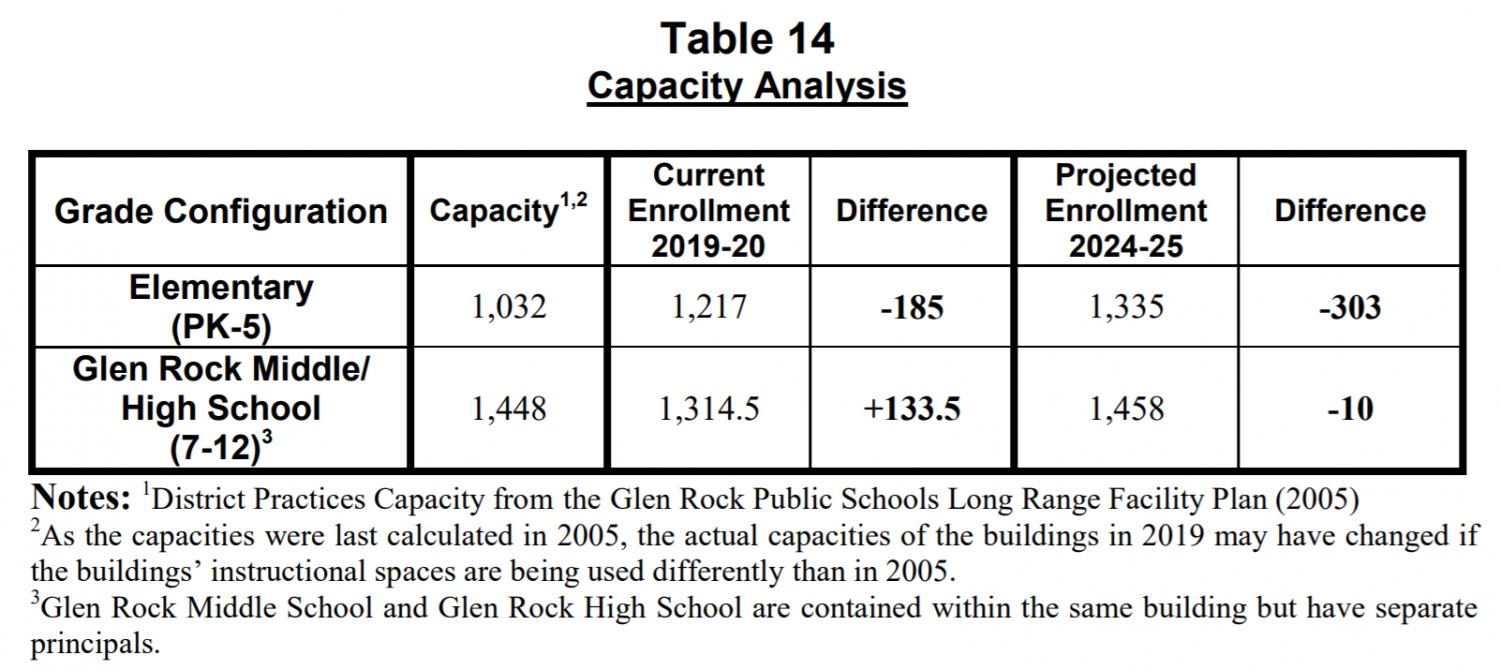
The table shows the capacity of the total buildings and the difference from the capacity. In the notes underneath, it states that the LRFP is old and has possibly changed since its creation.
In this table, unseated and surplus of seats for students were located below the difference column, negative meaning unseated and positive meaning the opposite. This difference is based on the student to teacher ratio that the BOE creates. The elementary schools are currently in the negative while the high school is the opposite and will possibly in 2025 be in the negative by 10 seats which are considered okay.
Conclusion of the Study
The study found that enrollments are projected to increase greatly in the next five years, continuing the trend that has been seen in recent years. Although a decline in births and fertility rates, the birth to kindergarten ratio and survival ratios have grown due to very strong inward migration found from home sales and coincide with high birth to kindergarten ratios. Insufficient seating will be more profound in the elementary schools while the middle and high schools will have very little unseated students.